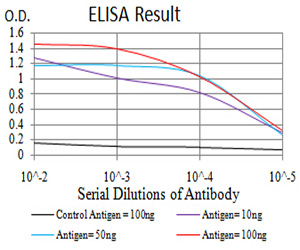
Figure 1:Black line: Control Antigen (100 ng);Purple line: Antigen (10ng); Blue line: Antigen (50 ng); Red line:Antigen (100 ng)
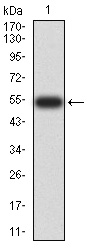
Figure 2:Western blot analysis using YWHAB mAb against human YWHAB (AA: 1-246) recombinant protein. (Expected MW is 54 kDa)
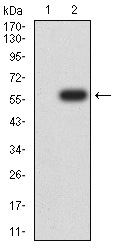
Figure 3:Western blot analysis using YWHAB mAb against HEK293 (1) and YWHAB (AA: 1-246)-hIgGFc transfected HEK293 (2) cell lysate.
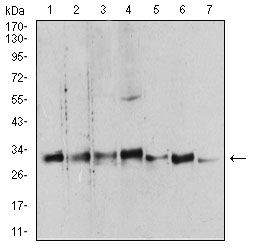
Figure 4:Western blot analysis using YWHAB mouse mAb against Hela (1), NIH/3T3 (2), C6 (3), A431 (4), K562 (5), PC-12 (6), and U937 (7) cell lysate.
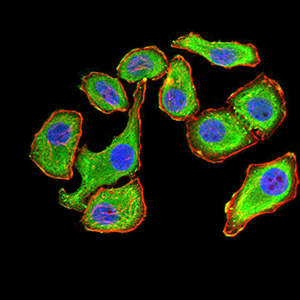
Figure 5:Immunofluorescence analysis of GC-7901 cells using YWHAB mouse mAb (green). Blue: DRAQ5 fluorescent DNA dye. Red: Actin filaments have been labeled with Alexa Fluor- 555 phalloidin. Secondary antibody from Fisher (Cat#: 35503)
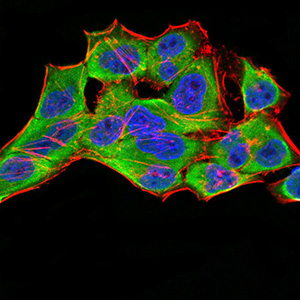
Figure 6:Immunofluorescence analysis of Hela cells using YWHAB mouse mAb (green). Blue: DRAQ5 fluorescent DNA dye. Red: Actin filaments have been labeled with Alexa Fluor- 555 phalloidin. Secondary antibody from Fisher (Cat#: 35503)
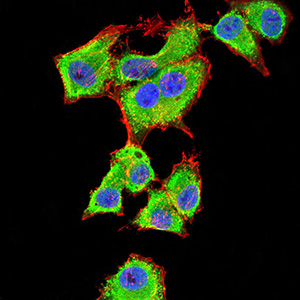
Figure 7:Immunofluorescence analysis of HepG2 cells using YWHAB mouse mAb (green). Blue: DRAQ5 fluorescent DNA dye. Red: Actin filaments have been labeled with Alexa Fluor- 555 phalloidin. Secondary antibody from Fisher (Cat#: 35503)
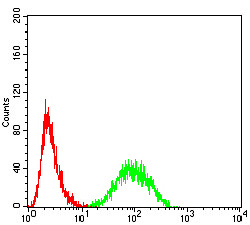
Figure 8:Flow cytometric analysis of Hela cells using YWHAB mouse mAb (green) and negative control (red).
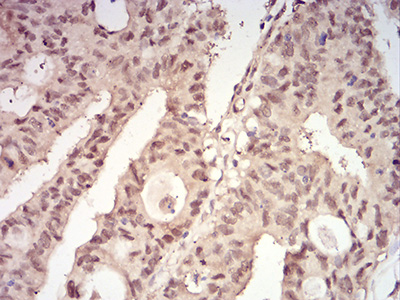
Figure 9:Immunohistochemical analysis of paraffin-embedded rectum cancer tissues using YWHAB mouse mAb with DAB staining.
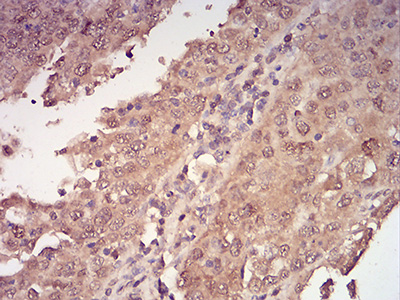
Figure 10:Immunohistochemical analysis of paraffin-embedded endometrial cancer tissues using YWHAB mouse mAb with DAB staining.