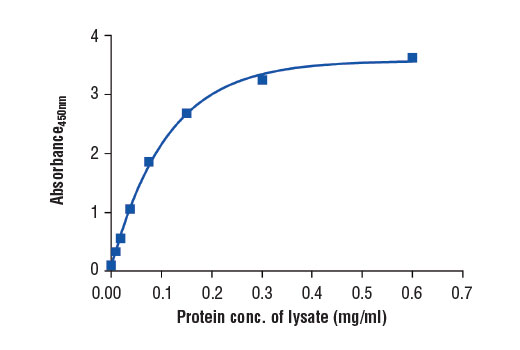
Figure 2. The relationship between protein concentration of lysates from HeLa cells and the absorbance at 450 nm as detected by the PathScan® Total GAPDH Sandwich ELISA Kit #7157 is shown. HeLa cells (85% confluence) were harvested and then lysed.
Go to product page
Image may be subject to copyright.