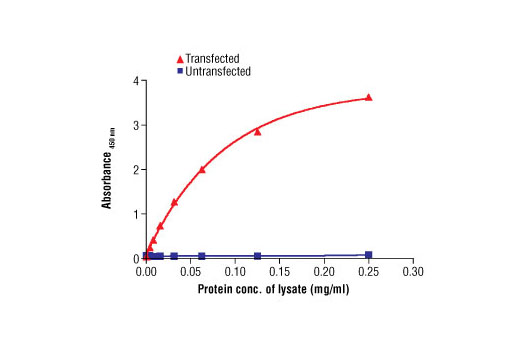
Figure 1. The relationship between the protein concentration of the lysate from untransfected and GFP transfected HEK 293 cells and the absorbance at 450 nm using the PathScan® Total GFP Sandwich ELISA Antibody Pair #7879 is shown.
Go to product page
Image may be subject to copyright.