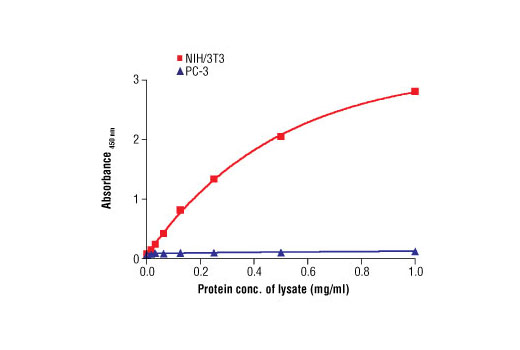
Figure 1. The relationship between the protein concentration of the lysate from NIH/3T3 (PTEN positive) and PC-3 (PTEN null) cell lines and the absorbance at 450 nm using the PathScan® Total PTEN Sandwich ELISA Antibody Pair is shown.
Go to product page
Image may be subject to copyright.