Images
Antibodies
Assays/Kits
Proteins/Peptides
siRNAs/Functional Genomics
Biochemicals
cDNA Clones
Cell/Tissue/Blood Products
Genes
Images
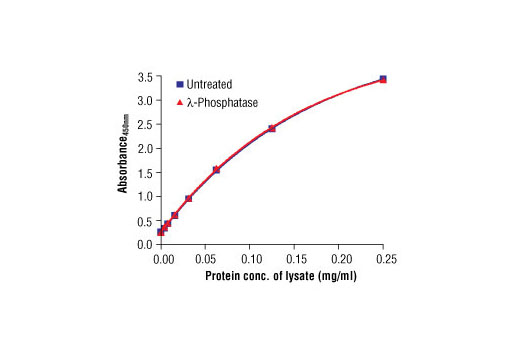
Figure 2. The relationship between lysate protein concentration from untreated and λ-phosphatase treated lysate from Calu-3 cells and the absorbance at 450 nm is shown.
Go to product page
Image may be subject to copyright.