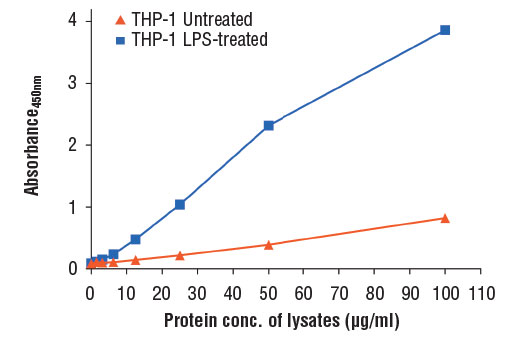
Figure 2: The relationship between protein concentration of lysates from untreated and LPS-treated THP-1 cells (1 μg/ml, 24 hr) and the absorbance at 450 nm as detected by the PathScan® Total CD44 Sandwich ELISA Kit is shown.
Go to product page
Image may be subject to copyright.