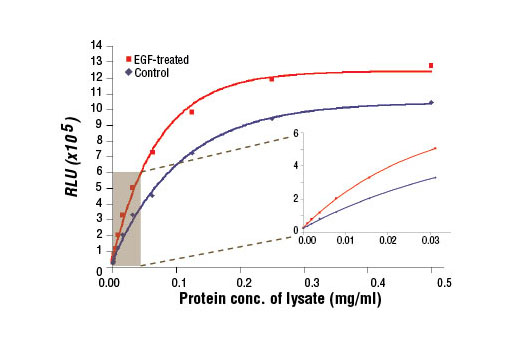
Figure 1. The relationship between protein concentration of lysates from A-431 cells, untreated or treated with hEGF #8916, and immediate light generation with chemiluminescent substrate. After starvation, A-431 cells (85% confluence) were treated with hEGF (100 ng/ml, 5 min at 37°C) and then lysed. Graph inset corresponding to the shaded area shows high sensitivity and a linear response at the low protein concentration range.
Go to product page
Image may be subject to copyright.